Thinking Maps® (Visual Tools)
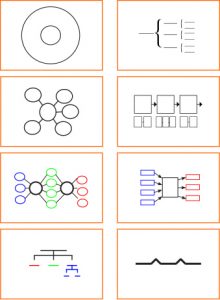 Thinking Maps®, created by David Hyerle, are consistent visual patterns linked directly to eight specific thought processes. By visualizing our thinking, we create concrete images of abstract thoughts to reach higher levels of critical and creative thinking individually and collaboratively. Thinking Maps establish a consistent language for thinking and problem solving. The goal is to have the students work independently choosing the cognitive process of a Thinking Maps® that best supports their thinking.
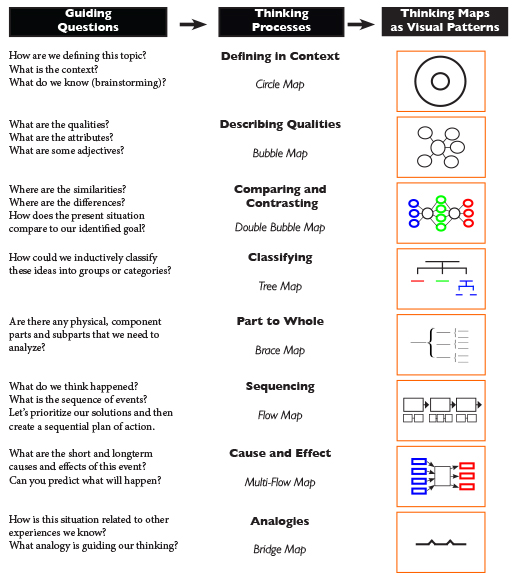
The language of Thinking Maps is a language of eight fundamental cognitive skills. These eight cognitive skills, as shown on the next page, are based on a synthesis of cognitive science research, models of thinking developed for psychological testing and educational programs, and a transformation of Dr. Upton’s early work with Designs for Thinking. This model is neither linear nor hierarchical. The eight cognitive skills are defining in context, describing attributes, comparing and contrasting, classification, part-whole spatial reasoning, sequencing, cause and effect reasoning, and reasoning by analogy. Each of the eight processes additionally can have a Frame of Reference to further expand information, schema and thinking. This language is not a comprehensive view of thinking; it identifies the coherence and interdependency of the eight fundamental cognitive skills that ground thinking and learning.
More about Thinking Maps® online can be found on the Thinking Maps® website and the Thinking Foundation website.
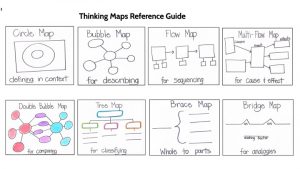
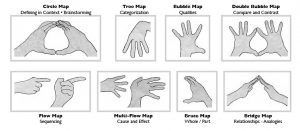
Thinking Maps® are a cognitive language of the way we think, adults think, children and youth think and how we as humans organize our thinking. The eight maps represent a language ultimately for the user to choose which best supports their organization of thinkings. Each of the cognitive processes (the eight maps) can be expanded with a frame of reference. The maps different cognitive processes are shared further below without and with a frame.
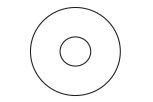 Circle Map • for defining in context / brainstorming
Thinking Process
Defining in Context is the process of becoming aware of and defining some “thing” in context by representing it using signs, symbols or drawings.
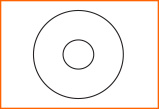 The Circle Map is used for brainstorming ideas and for showing prior knowledge about a topic by providing context information. In the center circle use words, numbers, pictures or any other sign or symbol to represent the object, person or idea you are trying to understand and define. In the outside circle write or draw any information that puts this thing in context.
Thinking Process
The process of describing is based on the use of words that identify qualities: character traits, emotional responses and other descriptors that reveal a more distinct representation of a problem, idea or person.
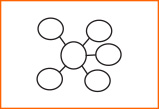 The Bubble Map is used for describing through the use of adjectives and adjective phrases. Unlike the Circle Map that is used for brainstorming, the Bubble Map is a tool for specifically identifying qualities and characteristics and for refining the use of descriptive words. In the center circle, write the word or thing being “described.” In the outside “bubbles,” write in adjectives and/or adjective phrases to describe something.
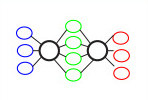 Double Bubble Map • for comparing and contrasting
Thinking Process
An extension of “describing” one thing is the process of comparing and contrasting things according to similar and different qualities.
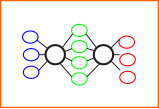 The Double Bubble Map is a tool for comparing and contrasting things. In the large circles, write the words for the two things being investigated. In the middle “bubbles,” use words and phrases that show similarity between the two things. In the outside bubbles, as connected respectively to the two things, write the words that identify their different qualities.
Thinking Process
Classifying is the process of sorting things into categories or groups and creating new categories, often according to common qualities.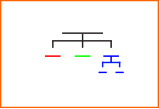
The Tree Map is used for classifying things and ideas. On the top line write the category name, on the second level of lines write the subcategories, and below each subcategory write the specific members.
 Brace Map • for whole / part relationships
Thinking Process
The common terms used to define spatial relationships are “whole to part” and/or “partwhole” reasoning. Whole- to-part reasoning is the process of identifying the relationship between a whole physical object and its parts.
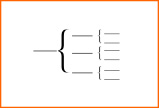 The Brace Map is used to analyze physical objects. On the line to the left, write the name of the whole object. On the lines within the first brace to the right, write the major parts of the object, then follow within the next set of braces with the subparts of each major part.
Thinking Process
Sequencing is the process of identifying the relationships between stages and substages of an event (or order of numbers, operations, steps, etc.).
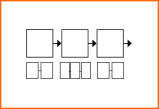 The Flow Map is used for sequencing and ordering information. In the outside rectangle write the name for the event, or sequence. In the larger rectangles-flowing from left to right-write in the major stages of the event. In the smaller rectangles below, write in the substages of each major stage.
 Multi-Flow Map • for Cause / Effect
Thinking Process
The process of sequencing is extended by identifying the interrelated causes and effects of events.
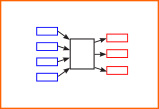 The Multi-Flow Map is used for showing and analyzing cause and effect relationships. In the center rectangle, write in an important event that occurred. On the left side of the event, write in the causes of the event, and on the right side, write in the effects of the event. As you identify more causes and effects, add them to the Map. If you are studying a system, you will find that there are effects in the system that, in turn, influence initial causes. This circular cause and effect relationship is called a feedback loop.
![]() Bridge Map • for analogies
Bridge Map • for analogies
and similarities between relationships
Thinking Process
Seeing analogies is the process of identifying similarities between relationships.
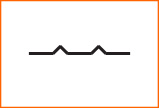 The Bridge Map gives people a tool for applying the process of seeing analogies. On the line to the far left, write in the relating factor. The relating factor is the similar phrase that fits both sides of an analogy. On the top and bottom of the left side of the bridge, write in the first pair of things that have this relationship. On the right side of the bridge, write in the second pair of things that have the same relationship. The line of the bridge represents the relating factor that is “bridged over” from one side of the analogy to the other. As a check for understanding, write the analogy as a complete sentence.
Thinking Maps® Rubric
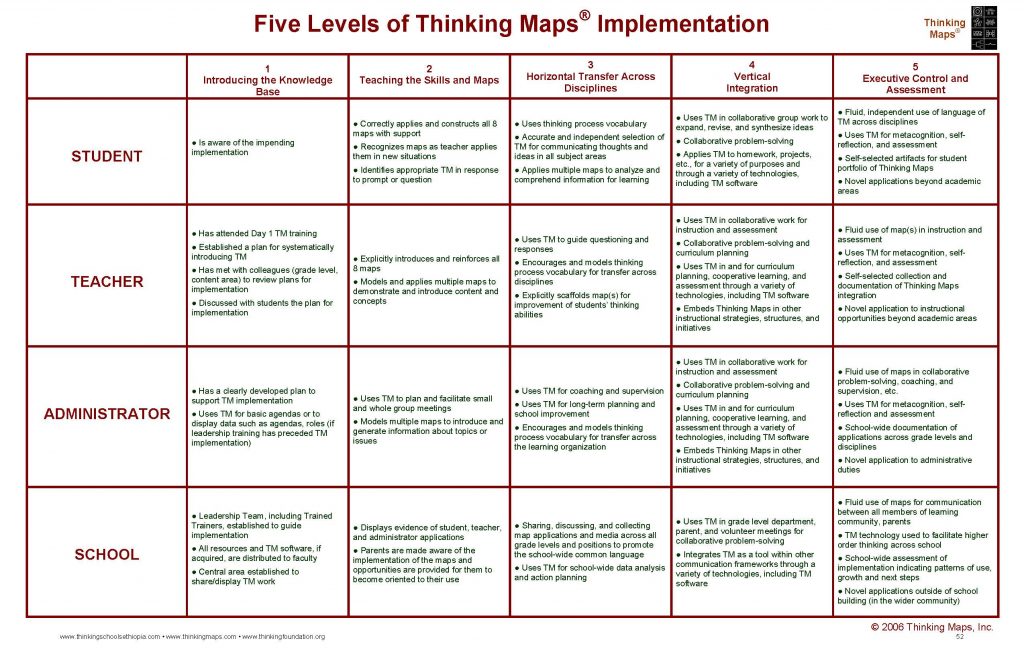
The following Five Levels of Thinking Maps® Implementation provides a pathway of implementation and assessment of implementation. The visual below can be downloaded as a PDF clicking here and on the image below.
Thinking Friends® for Pre-K
From the Thinking Foundation Website: Given the recent research in the cognitive-neurosciences and child development, Thinking Foundation supported research and development of an approach for Early Childhood Years education. The outcome is a systematic approach to facilitating child centered cognitive development, “Thinking Friends”. This program is offered as a foundation for Thinking Schools and early childhood centers. Given the recent research in the cognitive-neurosciences and child development, Thinking Foundation supported research and development of an approach for Early Childhood Years education. The outcome is a systematic approach to facilitating child centered cognitive development, “Thinking Friends”. This program is offered as a foundation for Thinking Schools and early childhood centers. It is available in both English and Spanish editions. More information about Thinking Friends® may be found on the Thinking Foundation website.

